Cleaning Parcels and Buildings data
Rationale
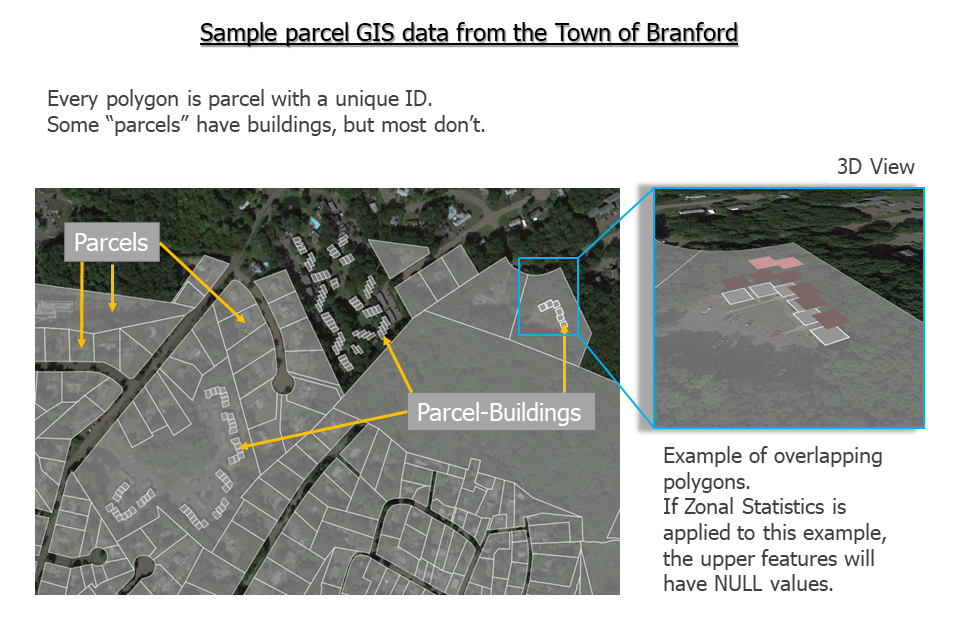
Each town (in Connecticut) has a GIS database with information on each parcels and buildings within the town. These datasets are optimized for accurately estimating tax revenues and appraised values of each home address (not the physical building). Meaning, in case of an appartment / condos where there are multiple address and home values for one physical building, one address/home can be on top of another in a GIS shapefile (ex: 1st floor and 2nd floor). More explicitly, they have the same building footprint but not the same values or actual flood risk.
In the Seawall Toolbox, the term ‘physical builing’ and ‘building footprint’ will be considered the same. And we assume that regardless of the number of homes in physical building, their will all share the same flood risk.
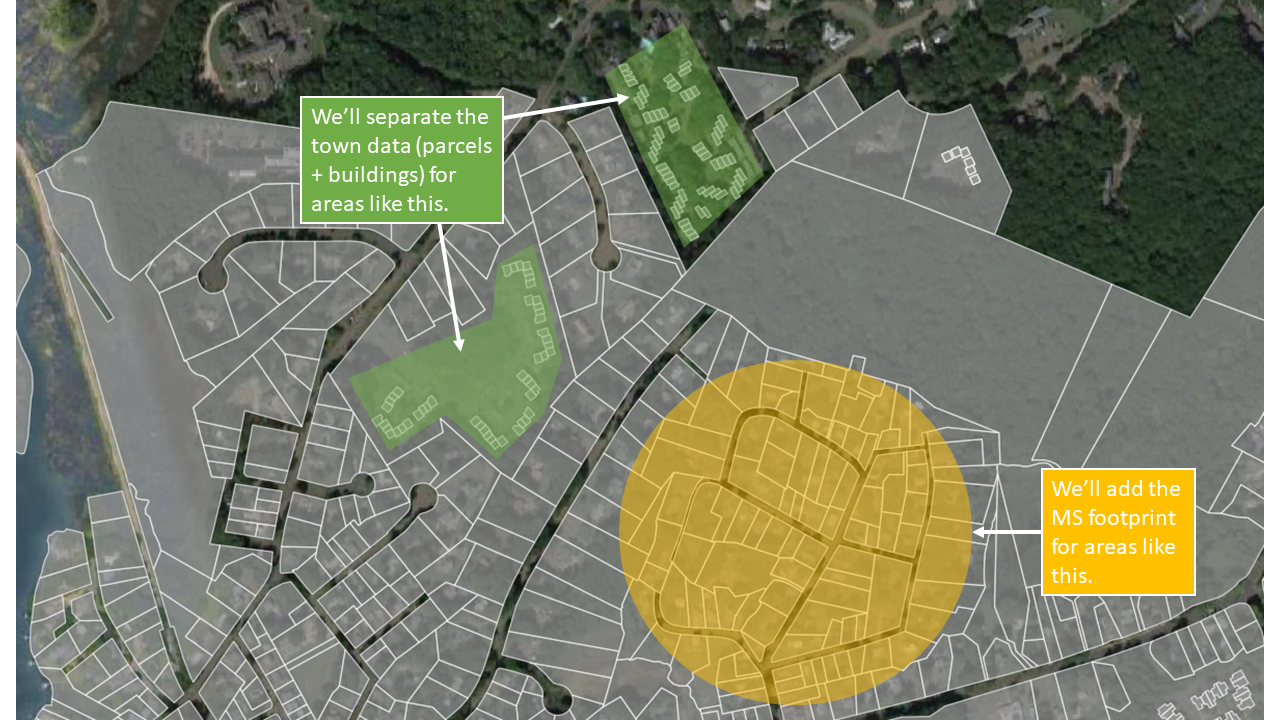
While only parcel locations are available from the town, Microsoft has recently published the footprint of almost all buildings in the US but without the market value of the buildings. The goal of this data processing is to combine these two dataset (town parcels + microsoft buildings) to generate 2 new datasets of parcels buildings each with their own economic value.
Elevation statistics of each parcels / buildings will also be added using high resolution DEM (which should be available for anyone wishing to conduct flood risk analysis). For any town in Connecticut, 2ft grid DEM are available at CTECO.
Before, moving forward with this tutorial, please make sure you have these data availble, you can download the Microsoft Building Footprints here. And you should contact the town or check their online website to get parcels/buildings economic value.
Workflow
After studying the structure of CT towns’ GIS dataset, we have concluded that they generally contains overlapping buildings. Fixing these overlaps is the main goal of this step.
There are 4 types of parcels in each town data. It is important to clarify here that parcels in a town data set refer to any polygons in that data.
Parcels that are already buildings (we’ll call them parcel-buildings);
Parcels that contain these parcel-buildings;
Parcels that only contain Microsoft buildings (MS Bldg);
Parcels that contain Microsoft buildings but not building value from the town data;
Parcels that doesn’t contain any Microsoft buildings but have building value from the town data (i.e. there is a building but it’s exact location is unknown).
These parcel/building information affect the elevation statistics of the building (i.e. the estimated flood risk).
And here is how this location look when we add the Microsoft Building footprint. Obviously, the 2 datasets complement each other: the town providing the economic information and the MS footprints providing the exact location of missing buildings.
Here is a simplified GIF of the full process:
The outputs of the Clean Raw Data tool are saved in a folder named cleaning-outputs. The final outputs are:
townname-buildings: for the (cleaned) buildings.
townname-parcels: for the (cleaned) parcels.